Computer says you like Roquefort quiche

There was a fun-for-all-the-family mid-1990s sit-com called 2point4 children. It was supposed to be about the average family, which had at the time 2.4 children, but the joke is that there’s no such thing as the average family, or 0.4 of a child – geddit?!? Statisticians are so funny, and so detached from reality! No one actually wants to be average and we all believe that there’s more to us than any single dimension that can be described in numbers. Nobel attempts to make numbers make sense to people range from David McWilliams’s Celtic tiger archetypes to this week’s YouGov Profiler.
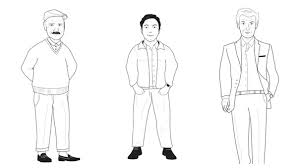
Celebrity economist McWilliams took to the streets and the motorways of Ireland in the mid-2000s trying to find the average person, or at least several archetypes, and used this technique as the basis for a couple of best-selling books. People could easily identify Breakfast Roll ManTM and the Hiberno-Cosmopolitans (HiCosTM), and even identify with them. The positions in society represented by each of these descriptions went beyond caricature and resonated to the extent that there was also a number one single called Jumbo Breakfast Roll. A similar presentation of several averages is increasingly common in coverage of budgets, for example, where analysis is presented of the impact on individuals and families with different characteristics in the hope that people will identify with one.
Panel-beaters
The YouGov Profiler uses a giant database, with 190,000 cases and probably hundreds of datapoints for each case, to tell us how consumers of a given product differ from everyone else. For example, people in Britain who are interested in statistics enjoy table tennis, Sudoku, and Lincolnshire plum loaf more than most other people. Once you get over the strange combination of the hilarity and the stereotypes (stats people describe themselves as analytical but on occasion nerdy), you’ll see this is not just a giant panel survey but a new way to make sense of and present data. It works something like this: Panel members give yes-no responses on lots of items, then the data science takes over. The probability of yes is calculated as the national average and scaled to a mean of zero and standard deviation of one. Taking a second category, like favourite football team, the probability of yes can be calculated for each team and compared to the national average. If your team is more than two standard deviations above the national mean preference for, say, profiteroles then a preference for profiteroles is identified as a distinguishing feature of Liverpool fans, a way in which they are outliers.
It’s a different conceptualisation of the outlier from the one that usually indicates a data entry problem, like someone being 17.5m tall rather than 1.75m. These distinguishing-feature outliers are purported to reveal a different kind of truth: the distinctive characteristics that set a group apart from everyone else. YouGov themselves distinguish between the “typical” person and what is “particularly true” relative to everyone else.
Yes, we are all different!
I’m not.
There has been a predictable back-lash on the social media and below the line just about anywhere that reported on the YouGov Profiler, basically along the lines of “It says people who like X also like Y but I like X and hate Y so it’s rubbish”. Of course, just by pointing out that these particular types and archetypes might exist, McWilliams had the effect of changing people’s behaviour as they self-consciously spotted the same flaws in themselves as he attributed to his characters: Many’s the potential Breakfast Roll ManTM became a Gym MonkeyTM in the last couple of years for fear of the high cholesterol associated with the breakfast-roll diet. Responses to the Profiler so far demonstrate an unease with being reduced to a list of preferences.
The effect of all of this is to make people think a bit, and then react. The Profiler is a market research project, and market research tries to find the cell-of-one, that is, to segment groups into smaller and smaller sets until they know enough about an individual to know exactly what to sell to them. Our reaction to someone’s attempt to pin us down is to move. Labelling people changes their behaviour, encouraging more of the same if it’s a positive label and suggesting a different course for a negative one. Any attempt to describe people in such detail unfortunately immediately destroys what it set out to describe by causing a reaction that makes those same people change their behaviour. So, no more vegetarian cholent for you or people will think you’re a psychologist!
Sign up to receive our weekly job alert
Featured Jobs
The Cochrane Collaboration
Remote - United Kingdom, Germany or Denmark
March 06, 2026
Medicines and Healthcare products Regulatory Agency
London, UK
February 22, 2026
Metronomia Clinical Research
Remote United Kingdom
February 25, 2026


